We created How-To Videos!
|
We know it can feel overwhelming to use a spreadsheet for the first time.Don't worry, these videos will guide you through the process. You can watch them all at once or just use the parts you need when you need it. You will learn how to properly enter your data you can
|
|
Putting your Data into a Spreadsheet
|
|
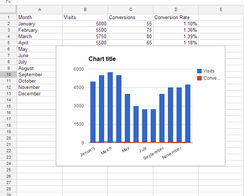
This video show how to enter your data into a spreadsheet. The spreadsheet will figure your averages for you. This video will also show you where to put your data so the graphs are made properly. |
Making a Chart in Google Sheets
|
|
Once you have all your data in the spreadsheet you are ready to make your graph. Before you start make sure you have your manipulated variables and responding variables in the proper rows and columns.
This video will guide you through the steps to create your graph and all the lables. |
Copying Spreadsheet Charts to a Doc
|
|
Once you have your charts and graphs made you still need to get them into your Final Project Report. That means you need to copy them from the spreadsheet to a Google Doc.
This video will show you how to copy your graph into a doc and resize it once it's there. |
